CONFLEX Spectra Analyzer
CONFLEX Spectra Analyzer program can sum up multiple calculated spectrum data calculated by CONFLEX or Gaussian program. Each spectrum components are weighted using Boltzmann distribution based on calculated energies.
This program supports following file types:
- CONFLEX: Vibrational Calculation
- CONFLEX: UV/CD
- CONFLEX: Powder X-Ray Diffraction
- Gaussian: Freq, VCD
- Gaussian: UV/Vis
The following types of analyses can be carried out using CONFLEX Spectra Analyzer:
- Display a group of calculated UV/Visible, IR or VCD multiple data files
- Superposition of powder X-ray diffraction patterns from the crystal search results
- Synthesis according to the Boltzmann distribution obtained from the energy
- Select a spectrum to synthesize
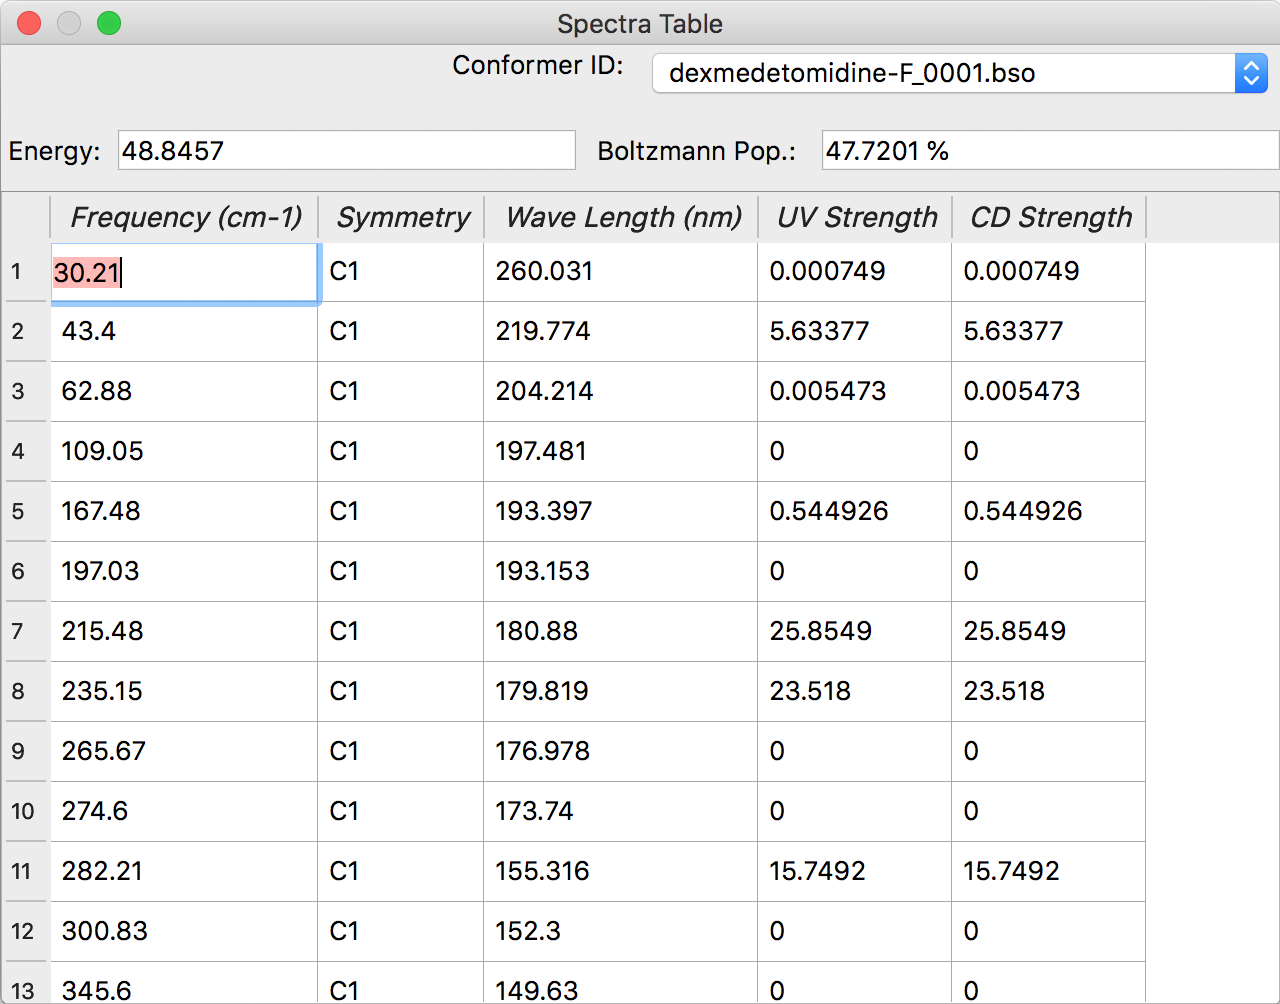
- Display spectra data in table form
Launch the Program
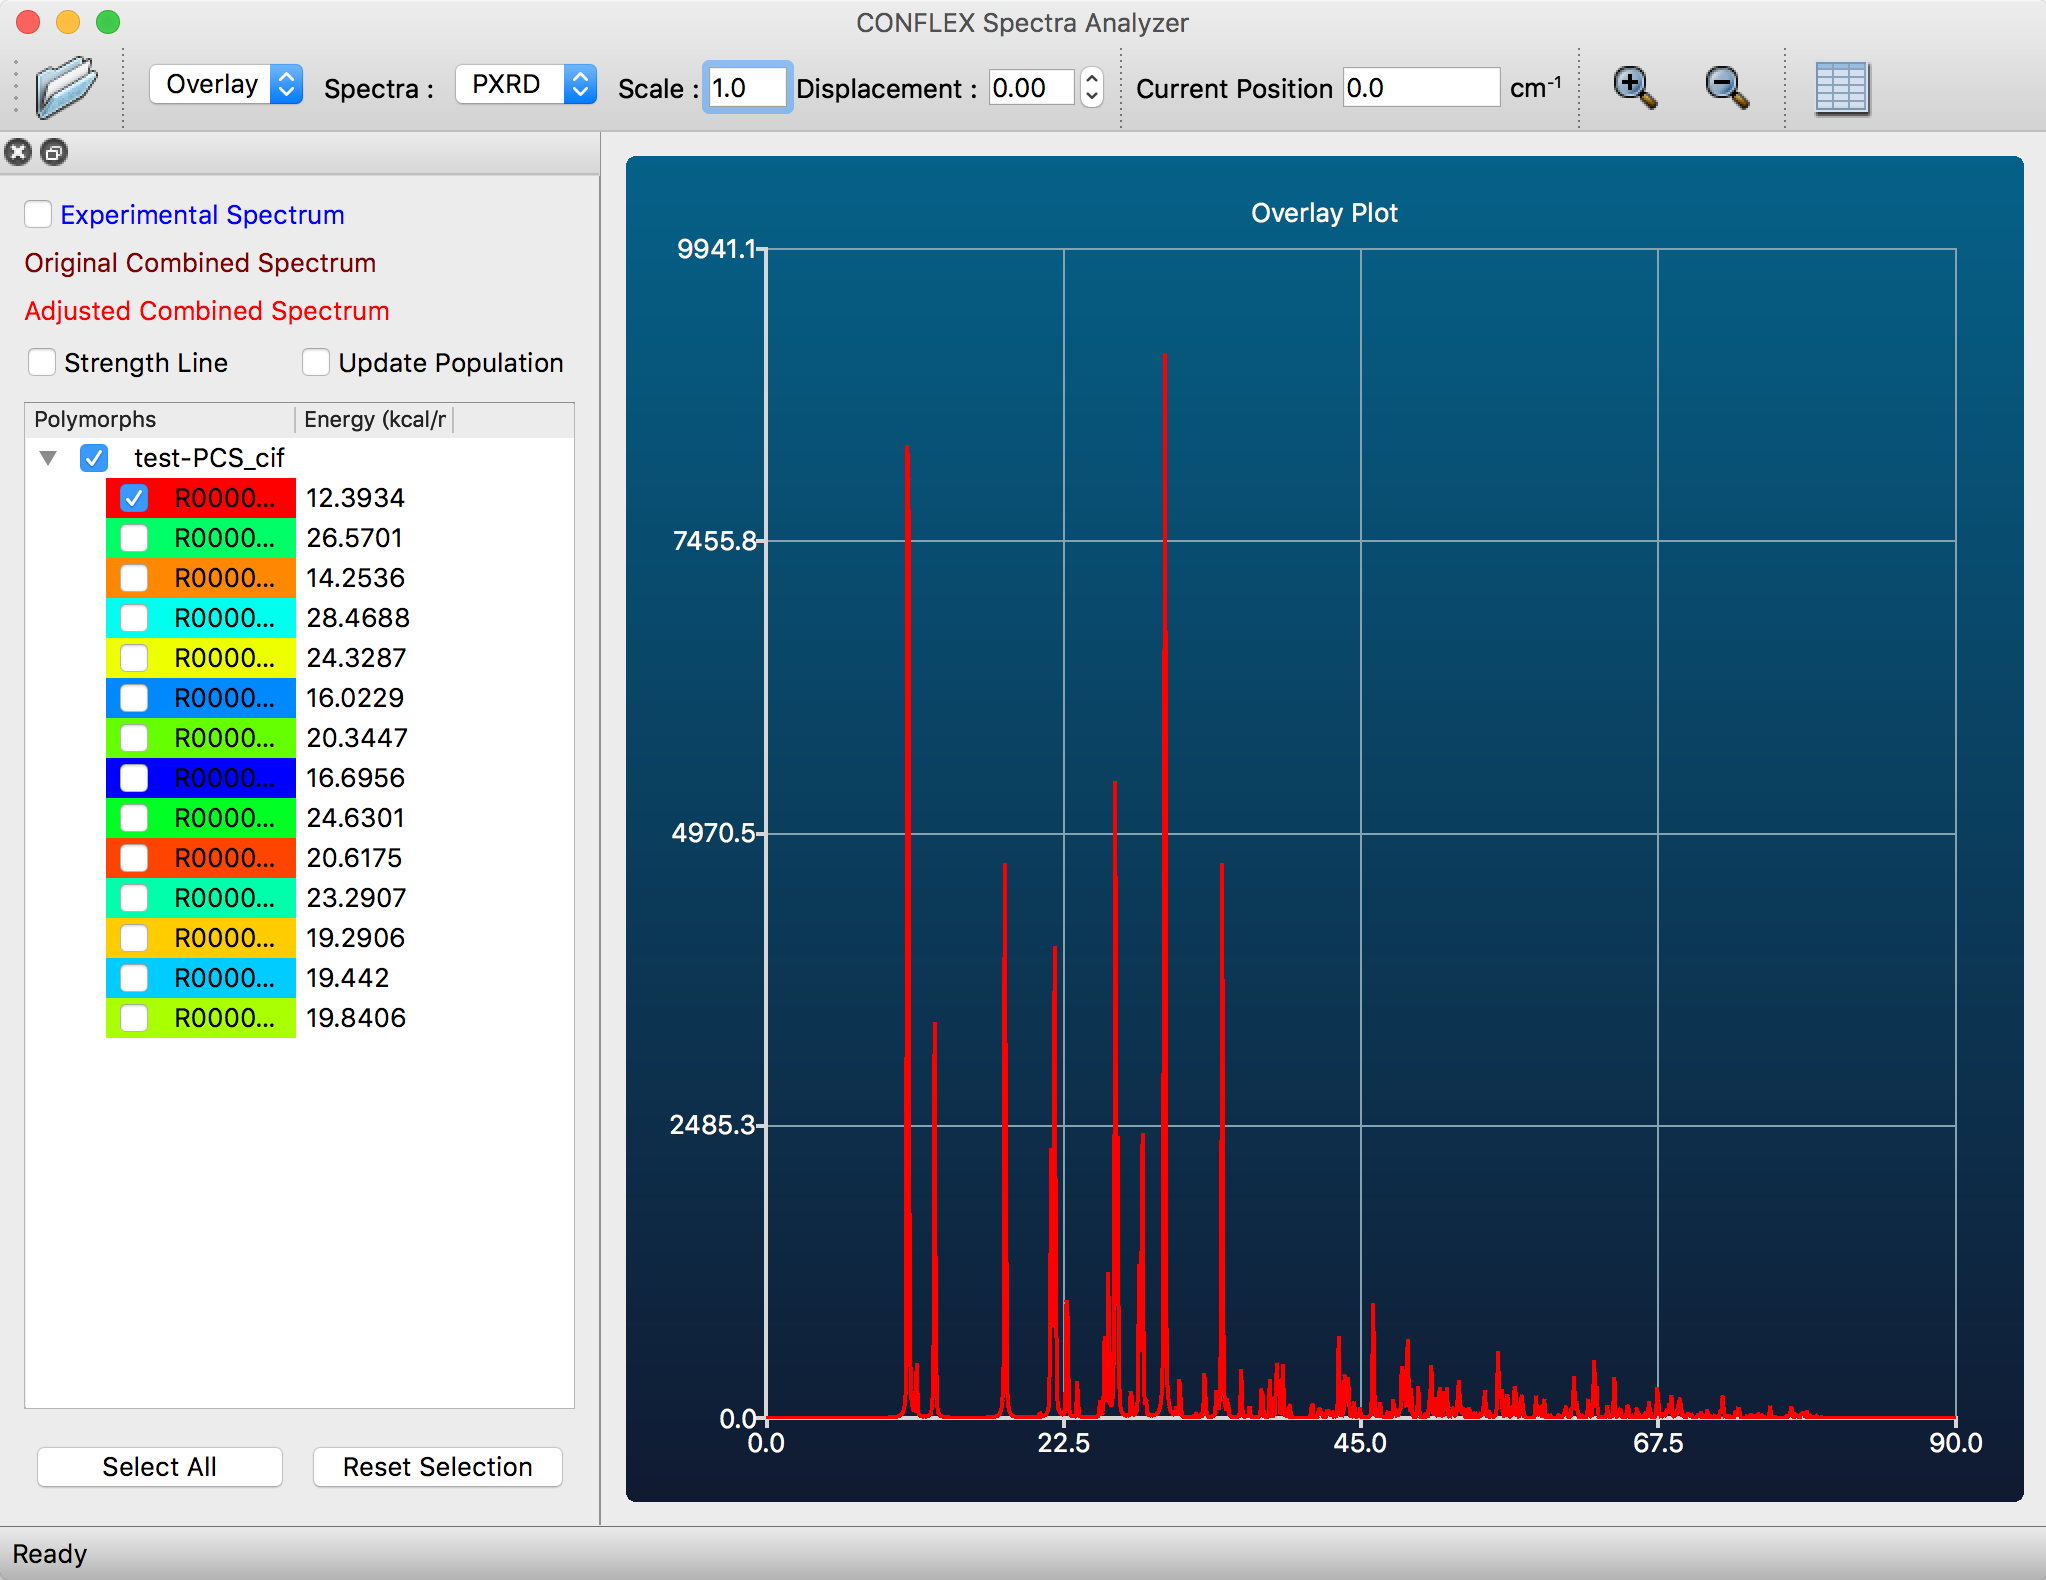
Spectra Analyzer application can be launched from [Applications] menu of CONFLEX Interface. At this time, a working directory path is automatically passed from CONFLEX Interface's active molecular window. Then, all related files are opened and read spectrum data automatically.
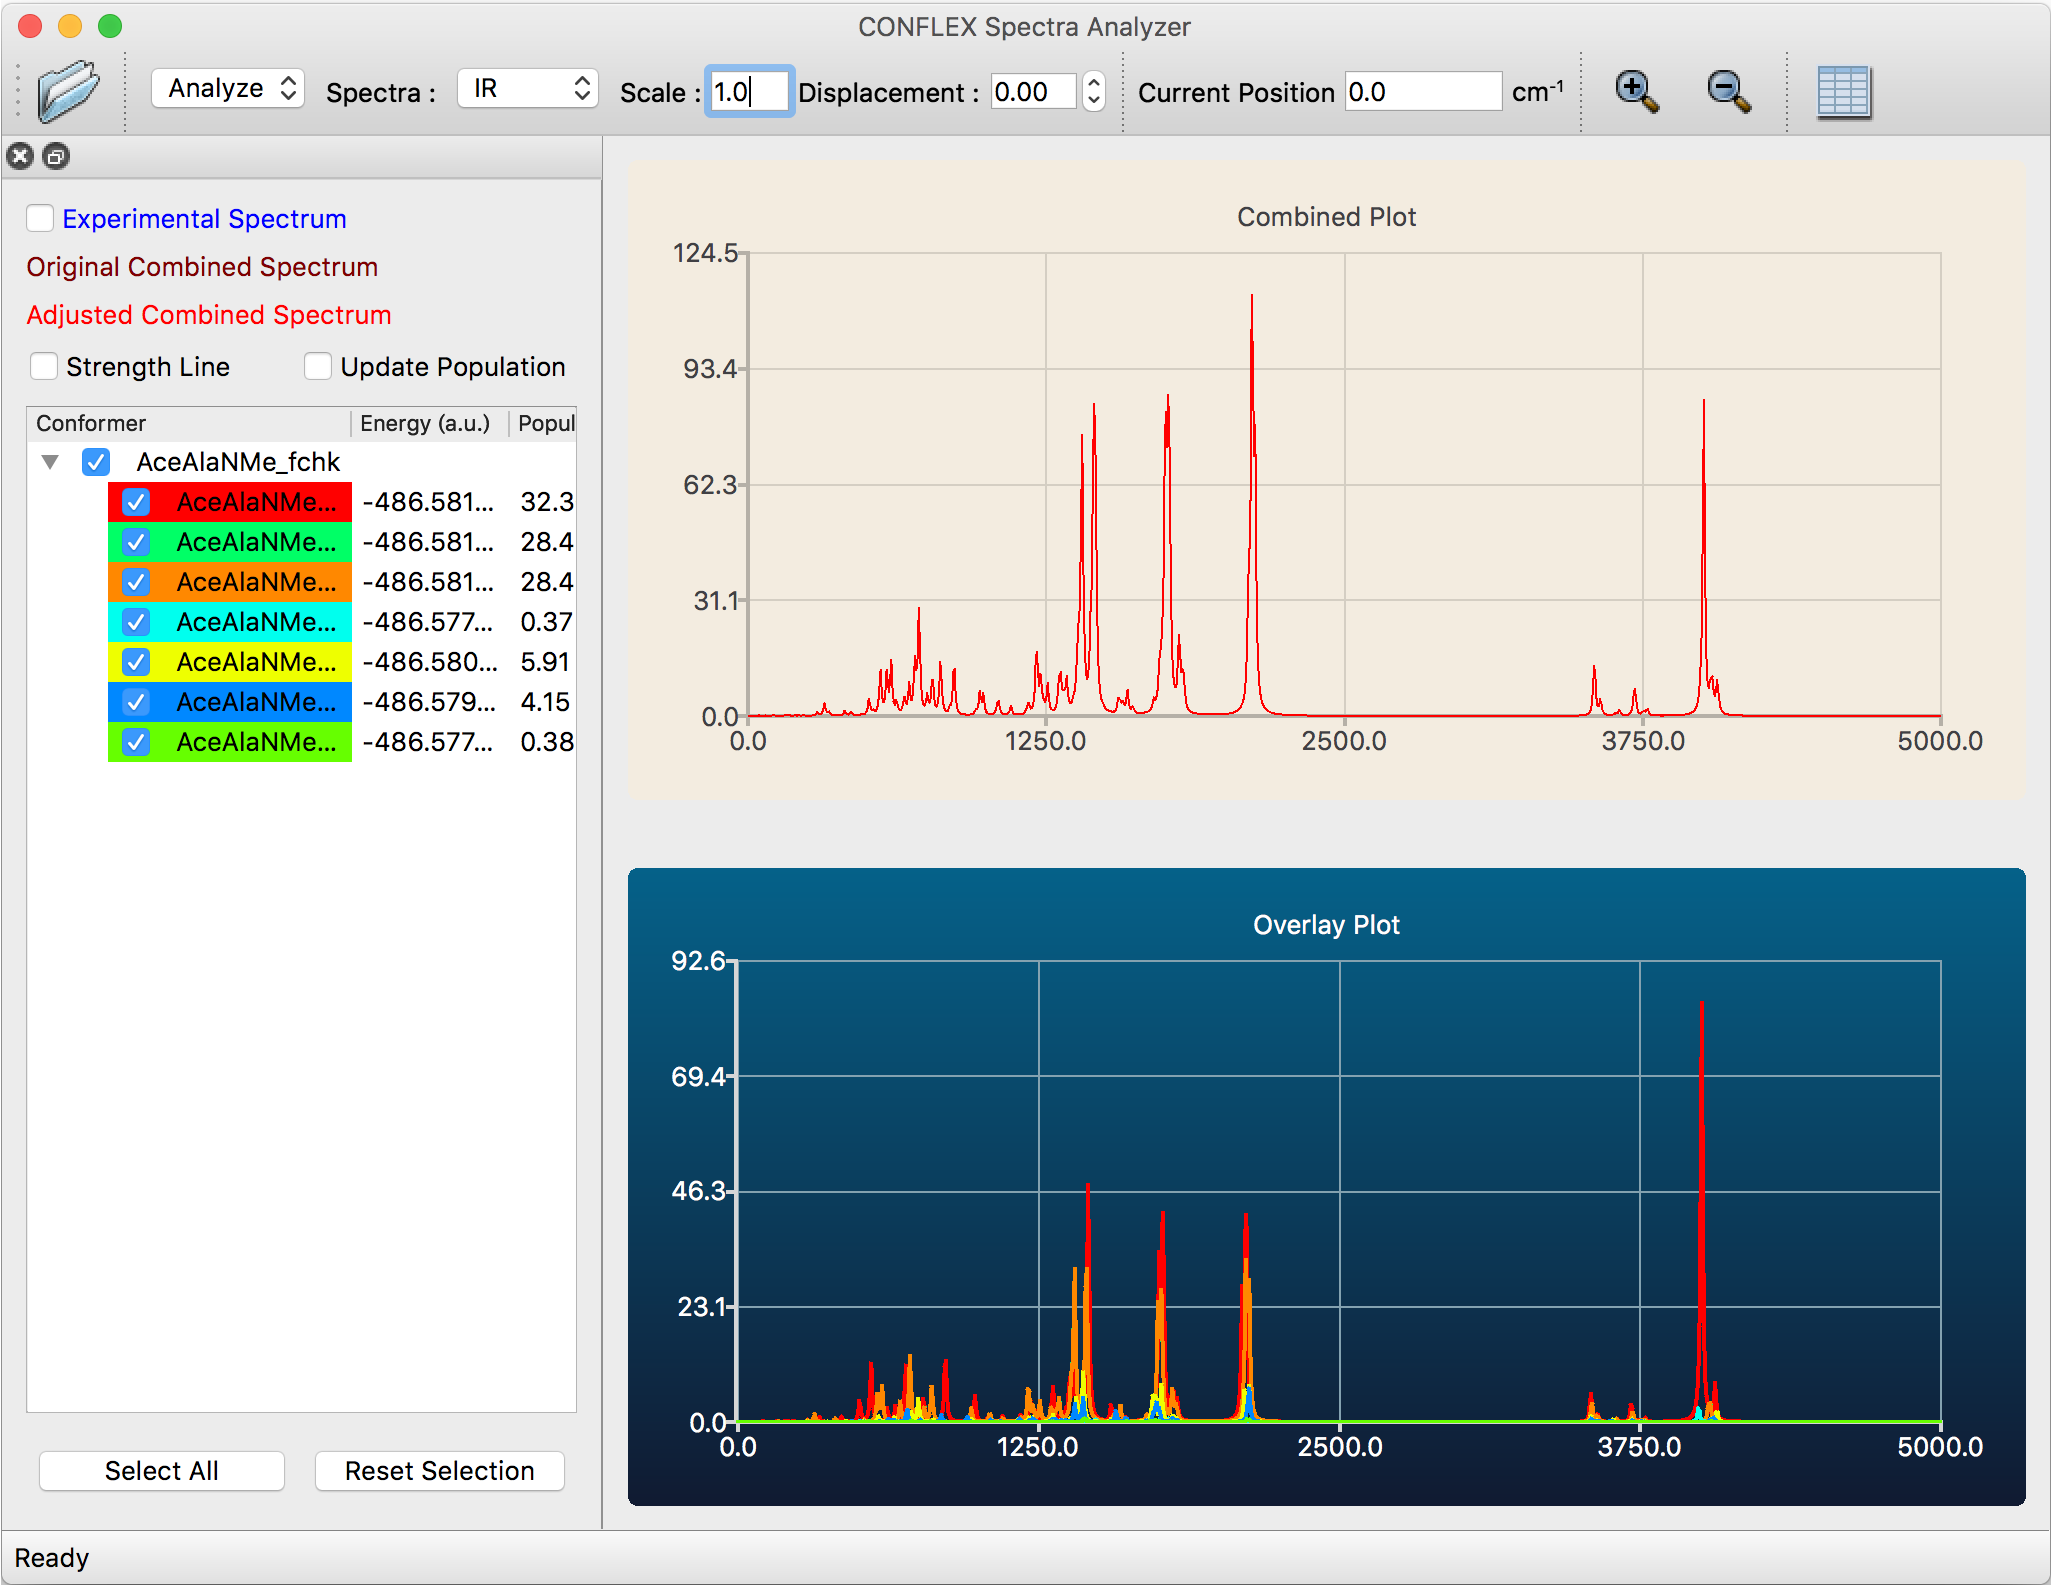
The application window shown in the figure above shows that 7 files are loaded and displayed 7 spectra (lower sub-window) and composed spectrum (upper sub-window).
Feature Description
File Menu
This is used to open folder that contain CONFLEX or Gaussian output files. Select [File] → [Open Folder] or click [Open Folder] button inside toolbar, then opens File selection dialog. User can specify one of the file path containing spectrum data. The program opens all of related files in the same folder.
The user can also open experimental PXRD data using [File] → [Open Experimental Data] and overlay it on the chart.

View Menu
Spectra
The user can swith view by selecting [IR], [Raman], [UV], [CD], or [PXRD] spectra from [Spectra] in the [View] menu. The user can also use toolbar [Spectra] pull-down menu.
Scale
By changing the value of [Scale] in the toolbar, it is possible to adjust the absorption wavenumber by that value.
Displacement
If you enter a number in the [Displacement] field in the toolbar, you can shift each spectrum upward in the Compo- nents spectrum display according to that number.
Show Table
Opens table view window and display spectra data. The user also use toolbar's [Show Table] button.

Main Window
The main window is separated into right and left sub- windows. The left sub-window contains file names, energies and population of conformers based on Boltzmann distributions. The right sub-window contains [Combined Plot] and [Overlay Plot] charts. The [Combined Plot] displays charts combined all or selected spectra. The [Overlay Plot] displays selected charts overlaid with each other.
The user can change components by clicking checkbox next to the file name.
Select All
By clicking this button, all con- formers are selected.
Reset Selection
By clicking this button, only first item is selected.
Both [Combined Plot] and [Overlay Plot] can be zoomed in and out by mouse operation in the same way as the spectrum display operation of CONFLEX Interface. For details, see the Interface manual.
The user can switch display mode between [Analyze] and [Overlay] using dropdown menu on the left side of toolbar.
In [Analyze] mode, a graph with synthesized spectra and a graph with each spectrum individually superimposed are displayed side by side.
In [Overlay] mode, only overlaied spectra chart will displayed.
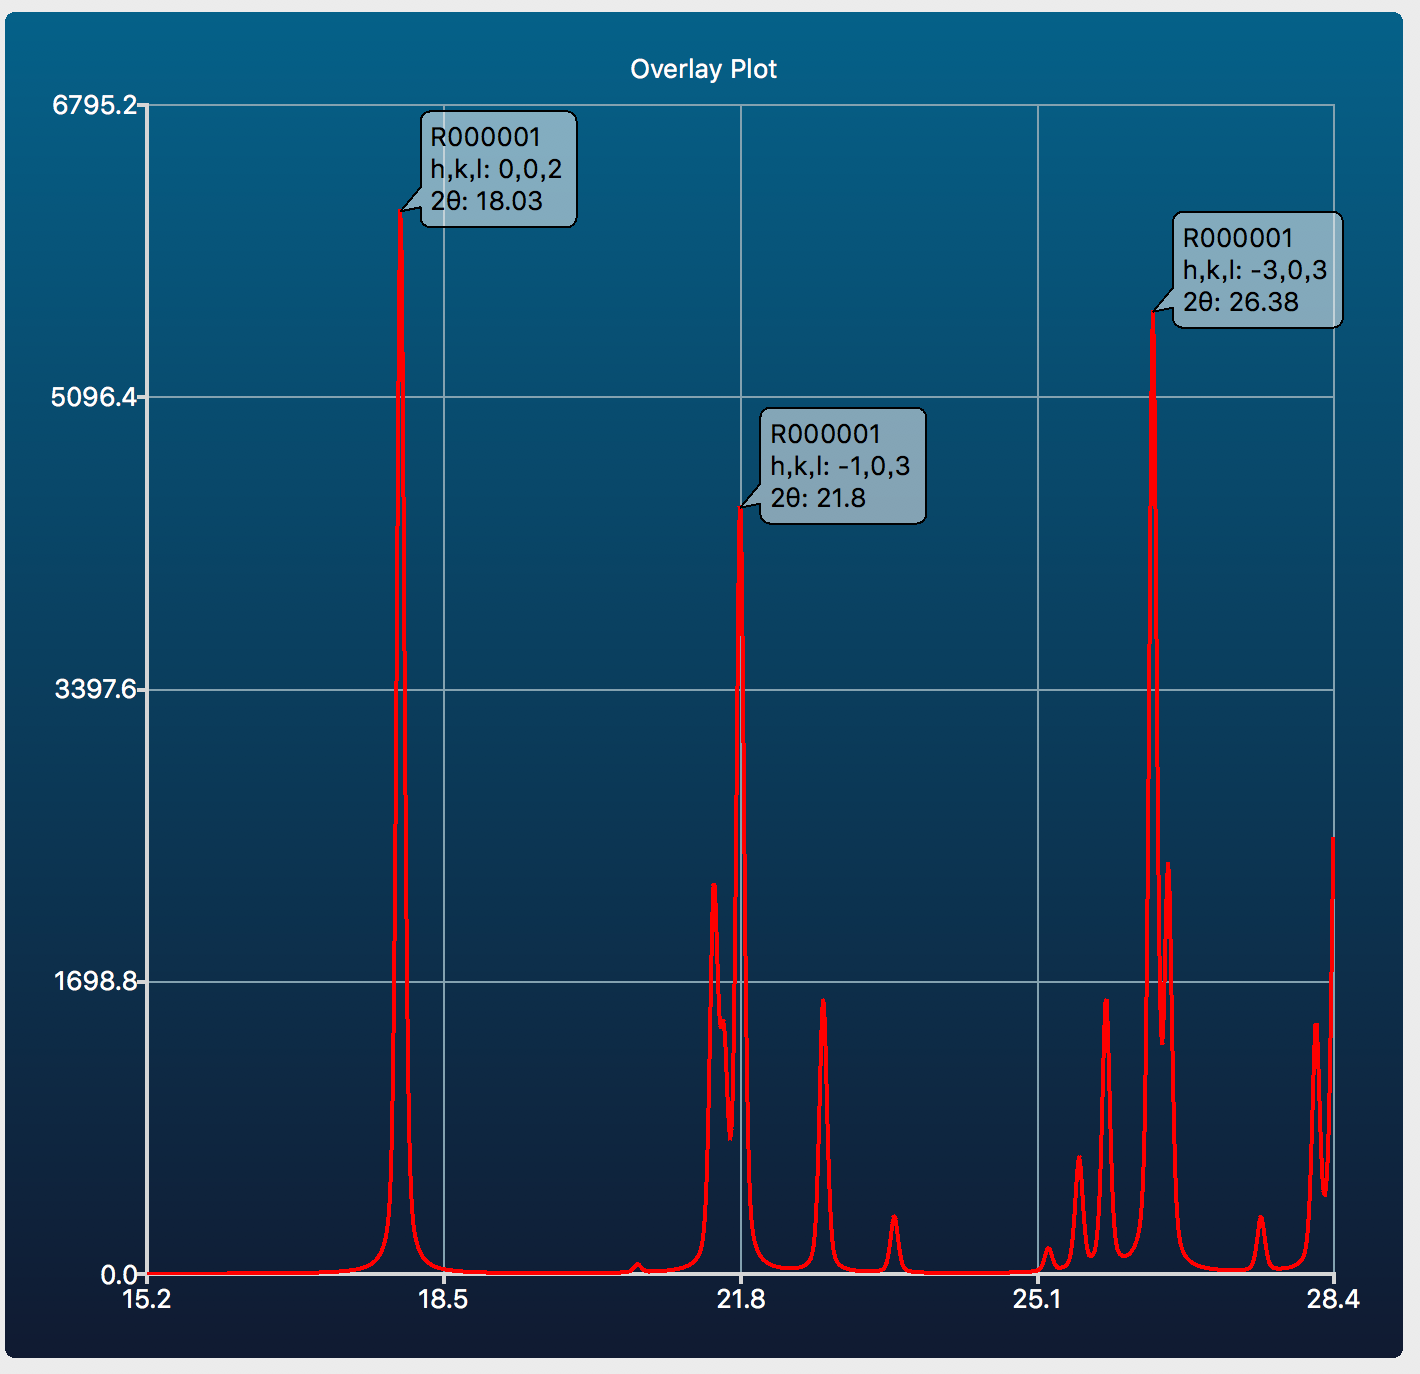
Callout feature
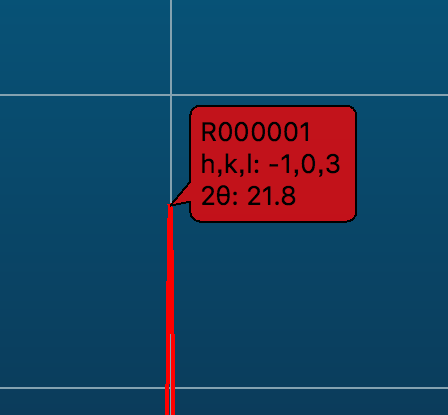
If mouse cursor hovered over chart, callout appeared with peak informations. If user click same point, callout is kept in the same position.
If user hovered mouse cursor again with same position of callout, the color of callout changes to RED, then user can delete this callout by clicking it.
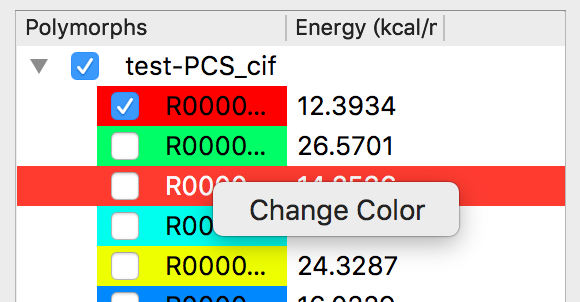
Char Color
If user right-click to the list item within left part of main window, [Change Color] sub-menu item displayed and change chart color.
Strength Line
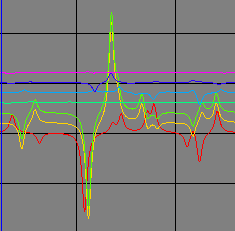
If the user checked the [Strength Line] box, the components of spectra are displayed in lines.
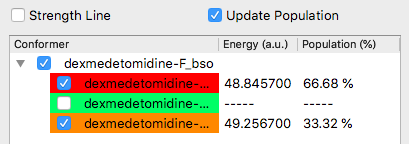
Update Population
If the user checked the [Update Population] box, the populations are recalculated by using only checked items and updated.